 Skip to content

You've probably opened a ranking export on a Monday morning, seen a long list of keywords, and felt no closer to knowing what to fix. The spreadsheet says a page moved, but it doesn't say whether that movement will bring in more calls, more map views, or just a nicer-looking chart. That's the problem with most search engine ranking reports. They record activity, but they don't always help you choose the next practical step.
For a UK local business, the useful report is the one that answers a simple question. What should we change next on Google Business Profile, the website, or both? Google's own reporting model already centres on clicks, impressions, CTR, and average position in Search Console, which gives ranking reports a solid base to work from, especially in a market where Google dominates search behaviour (Statcounter search engine market share). The rest of the job is turning those numbers into a decision document, not a vanity dashboard.
Table of Contents
- A Monday Morning With a Spreadsheet Open
- What a Search Engine Ranking Report Is
- Why Local Rankings Change the Rules
- Geo-Grid Reports and the Map Pack You Can See
- A Sample Weekly Report Template You Can Copy
- Reading the Numbers and Picking the Next Action
- Automating the Report So It Runs Itself
- Putting It All Together This Week
A Monday Morning With a Spreadsheet Open
A local plumber opens a fresh export and finds twenty rows of keywords, each with a different position. One term is up, another is down, and a third sits somewhere in the middle. The sheet is full of movement, yet it still leaves open the important questions. Has the phone rung? Has the Map Pack listing improved? Is a competitor in the next town taking the work?
That moment is common. A rank list can look like progress, but the list alone does not guide a business choice. A search engine ranking report becomes useful when it links visibility to a decision the business can make this week. For a local business, that decision might be improving a Google Business Profile category, tightening a service page, or refreshing photos that make the listing look active.
Practical rule: if a report does not help you decide what to change this week, it is just paperwork.
The strongest reports start with a sharper question than “how are we ranking?”. They ask, what is the next fix that could improve calls, directions, or clicks in Google Search and Google Maps? That shift matters because search visibility in the UK is not just a static position on a page. It shows up over time in Google's own reporting model and in the local surfaces customers use.
The spreadsheet is the evidence. The report is the brief that tells you what those numbers mean for the business.
What a Search Engine Ranking Report Is
A proper search engine ranking report is a structured record of how a keyword, page, or business listing performs over time. It usually combines keyword position, clicks, impressions, and CTR. That means click-through rate, the share of people who saw the result and clicked it. It also includes average position, which is the typical place a result appears across the reporting period, not a single moment in time.
A useful way to read the report is to separate what it shows into two layers. The first layer is the rank itself, or where a result sits in search. The second layer is the outcome, which is whether that visibility led to attention and traffic. Google Search Console's performance report uses these core fields, including query, landing page, clicks, impressions, CTR, and average position, so the format will already feel familiar to anyone who has used Search Console (Keytomic on search engine position reports).
A one-off rank check says, “you're third today”. A real report says, “you've moved from fifth to third across the last reporting period, clicks are up, and this page is now worth further work”. That difference matters because a rank position on its own cannot show whether the page is attracting attention or just sitting in the results.
For a small business, the report should work like a working note, not a scorecard. It should tell you what changed, what it affected, and what to do next.
Why Local Rankings Change the Rules
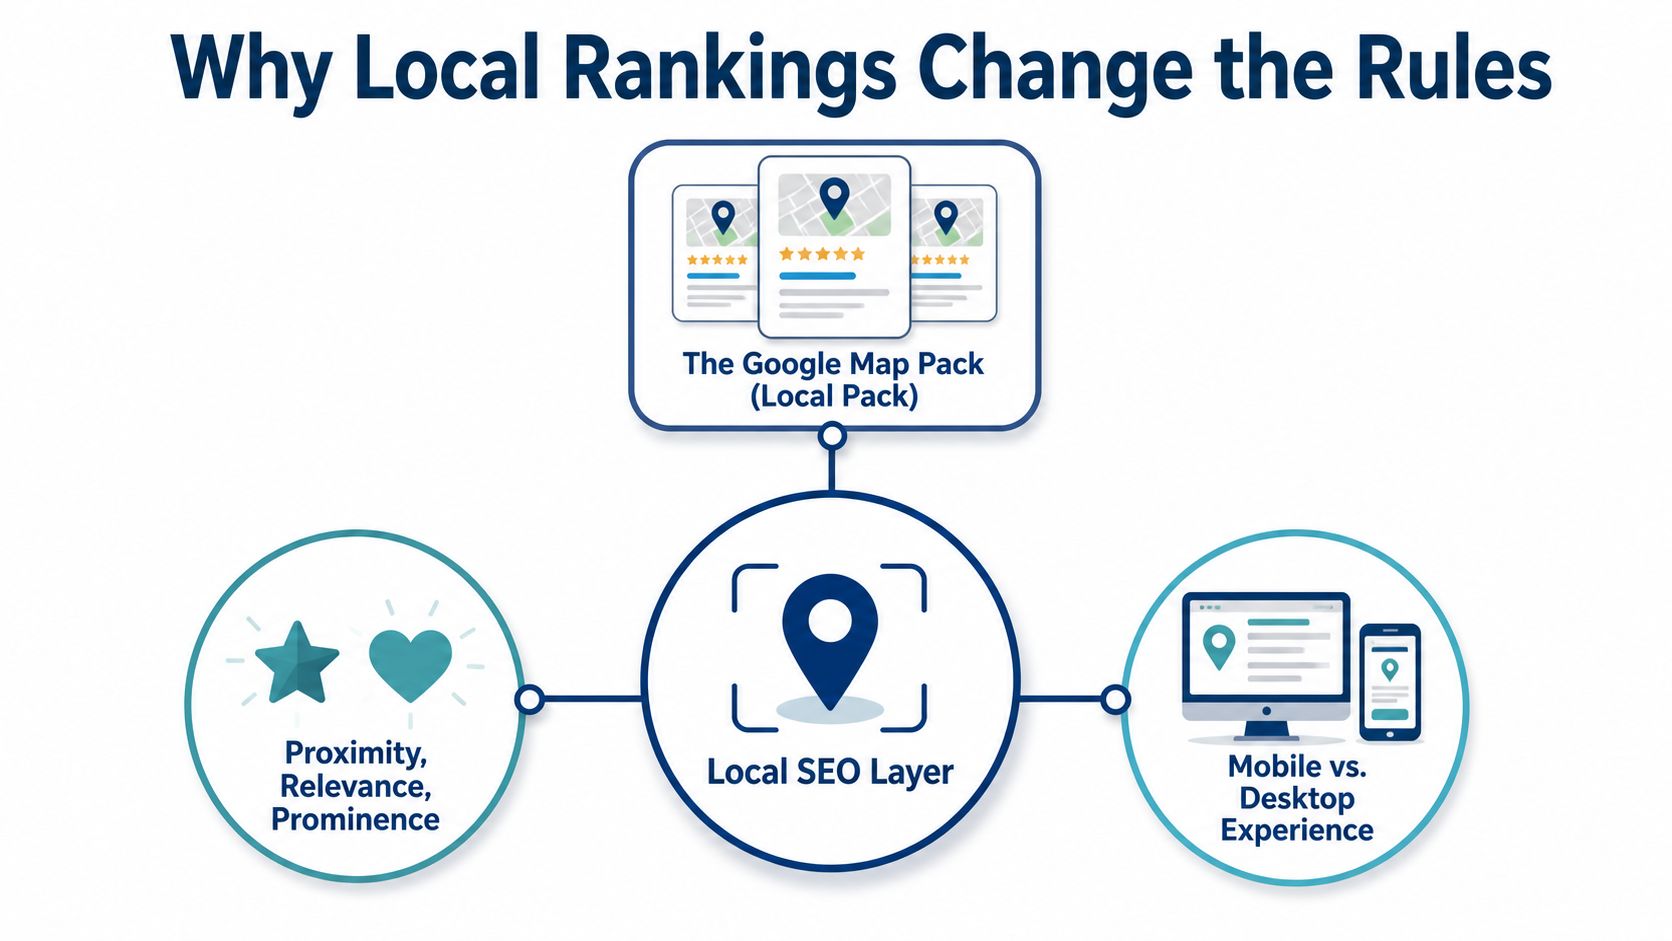
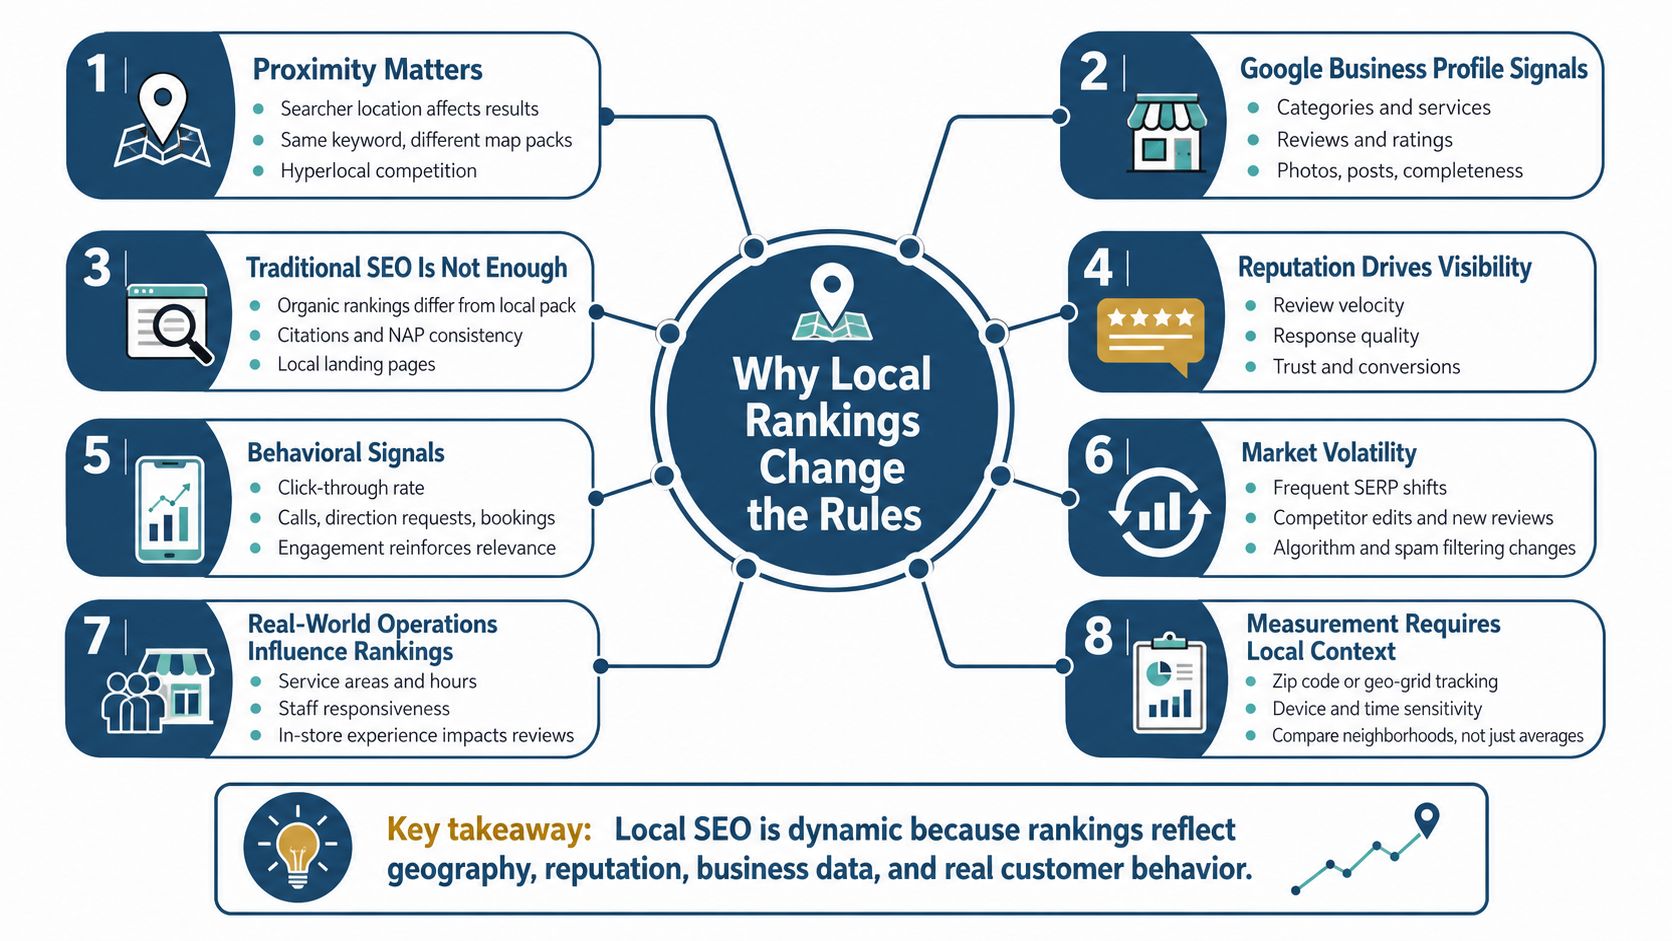
Generic ranking reports often treat Google as if every search happens the same way. Local search doesn't work like that. A business can rank well in the blue links and still miss the customers who are using the Google Map Pack, also called the local pack or local finder, because those results sit in a different part of the search page and are shaped by location.
That is why Google Business Profile matters so much. It feeds the local listing that shows up in Maps and the Map Pack, and that visibility can shift by place, device, and search intent. In the UK, this is especially important because local discovery often happens before a customer ever reaches a website, and a report that only tracks organic positions can miss the competition entirely.
Google's local ranking logic is usually described through relevance, distance, and prominence. Relevance is whether the listing matches the search. Distance is how close the business is to the searcher or the area being scanned. Prominence is the strength of the business signal, which can include how well established and trusted the listing looks. Those ideas are why local reports need more than a simple keyword column.
A business can “rank” and still be invisible to the people most likely to call it.
The practical takeaway is simple. A local ranking report should track both the organic result and the Map Pack result, then separate them by location where possible. That way you can see whether a change helped the business in the town centre, a nearby suburb, or a service area that sits a few miles away.
Geo-Grid Reports and the Map Pack You Can See
A geo-grid turns local ranking into something you can read on a map. Instead of showing one average position for one keyword, it scans a grid of points across a chosen area, then shows how the business performs at each point. That makes the report far more useful for service area businesses, because a listing can look strong in one part of town and weak just a short drive away.
The grid itself can be small or wide. A 5 by 5 grid gives a tighter view of one neighbourhood. A 7 by 7 grid spreads the picture out a little more. A 9 by 9 grid with a larger radius is useful when the business serves nearby towns or travels to customers across a wider area. The point is not to make the map prettier. The point is to reveal where the business is visible, where it fades, and where competitors take over.
A report also becomes more precise when you choose the scan centre on purpose. That matters when the keyword itself includes a place name, like a town or district. A manual centre lets you test the exact location that matters to the customer, instead of relying on a generic centre point that hides what people really see.
| Field | What It Tells You | Why It Matters Locally |
|---|---|---|
| Scan centre | The exact starting point for the grid | Helps you match the report to a town, suburb, or service area |
| Grid size | How many points are being checked | Shows whether visibility is tight or broad |
| Radius | How far the scan reaches | Useful for businesses that travel across a wider area |
| Keyword | The search term being tracked | Reveals whether the business appears for the service people actually use |
| Map Pack position | Where the listing appears at each point | Shows local visibility, not just one organic rank |
For businesses using Google Business Profile Manager, a grid report makes the next edit clearer. Google Business Profile Manager guidance matters most when it's tied to a visible pattern on the map, not when it sits in isolation.
A Sample Weekly Report Template You Can Copy
A weekly report works best when it's compact enough to read in a few minutes. Start with a summary block, then move into the local detail. That keeps the report from becoming a pile of disconnected charts.
Use five parts. First, a summary block with average position, clicks, impressions, and CTR. Second, a Map Pack visibility panel that shows where the listing appears most strongly. Third, a geo-grid snapshot that makes neighbourhood differences easy to spot. Fourth, a competitor comparison table. Fifth, a short prioritised action list that says what to fix and why.
| Field | What It Tells You | Why It Matters Locally |
|---|---|---|
| Average position | The overall search position across the period | Shows whether visibility is moving in the right direction |
| Clicks | How many times people chose the result | Connects ranking to real attention |
| Impressions | How often the result appeared | Helps you see if visibility is growing even before clicks rise |
| CTR | The share of impressions that became clicks | Flags weak titles, poor snippets, or low appeal |
| Map Pack share | How often the business appears in local results | Critical for calls, directions, and nearby searches |
| Geo-grid pattern | Where the business wins or loses by area | Shows whether the issue is local, not just sitewide |
| Competitor category | How rivals are positioned | Helps you spot category mismatches |
| Review count | How much review evidence competitors have | Stronger local trust often supports stronger visibility |
| Photo count | How complete the listing looks | Fresh visual signals make the profile feel active |
| Post frequency | How often the listing is updated | Helps you judge whether the profile looks maintained |
Competitor fields belong in the report because local ranking is comparative. You're not only asking whether your listing is good enough, you're asking whether it looks stronger than the other profiles nearby. In practice, that usually means checking category fit, review activity, photos, and whether the profile looks alive.
Use this rule for the table: if a field doesn't change a decision, leave it out.
A report like this can be sent weekly when the market moves quickly, or monthly when changes are slower. The key is consistency, not volume.
Reading the Numbers and Picking the Next Action
A ranking report becomes useful the moment someone asks, “so what?”. That question matters most when the report shows movement that looks positive on paper but doesn't translate into better clicks or local enquiries. A page can climb and still underperform if the snippet is weak or the listing doesn't match the search intent.
The clearest signal is often movement in the top three. In Google Search, the average top-ranking result has an organic click-through rate of 9.28%, while positions two and three average 5.82% and 3.11% respectively (Ahrefs SEO statistics). That is why a small climb inside the top three matters more than a vague improvement somewhere on page one. The report should highlight those shifts first.
A drop in CTR alongside a better position usually means the result is losing the click, not the visibility. That can point to a title tag that doesn't match the query, a snippet that looks weaker than a competitor's, or a local pack result that is taking attention away from the organic listing. The report should make that distinction obvious.
You can turn findings into actions with a simple priority note beside each item:
- Missing secondary categories: add them if competitors in the Map Pack are using more specific profile signals.
- Low review volume or slow review flow: focus on review collection and review responses.
- Sparse photo set: refresh imagery so the profile looks current and active.
- Inconsistent opening hours: correct them if searchers are likely checking availability.
- Weak snippet appeal: adjust page titles and descriptions so the listing earns the click.
If your platform supports automated comparison, use it. VisiLocali, for example, combines profile and competitor analysis with prioritised recommendations for local changes, so the report points directly to the next GBP fix rather than leaving the team to guess.
Automating the Report So It Runs Itself
Manual reporting turns into a chore quickly. A better setup is to let the data arrive on schedule, then spend your time reading what changed and choosing the next action. That means connecting Google Search Console and Google Business Profile, running a repeatable geo-grid scan, and sending the result to the people who need to act on it.
A simple workflow starts with the core performance data from Search Console, then adds a regular local scan at the same radius so the comparisons stay fair. Set alerts for meaningful shifts in position or visibility, then attach a short AI-written summary that explains what moved and what needs attention. The point is not to replace judgement. The point is to remove the repetitive admin that keeps the report from becoming a working document.

A good automated report also supports the rest of the local workflow. Review management, post scheduling, and basic performance checks can sit alongside the ranking data, so the team sees the signal and the action in one place. If a competitor jumps ahead in the Map Pack, Local competitor analysis guidance helps you understand what changed and how to respond. A free rank checker tool can help you validate individual keyword positions before you build the full automated report.
The routine can stay very simple.
- Connect the data sources: start with Search Console and Google Business Profile.
- Schedule the scan: keep the radius and grid consistent so changes stay comparable.
- Set alerts: flag major changes, not every tiny fluctuation.
- Summarise the week: let AI draft a short narrative, then review it manually.
- Assign ownership: every priority needs one person and one next step.
If the report arrives but nobody owns the fix, the report has not done its job.
Putting It All Together This Week
A ranking report becomes useful the moment it helps a local business decide what to do next. Start with the pages, keywords, and locations that affect calls, directions, and enquiries, then ignore the rest for now. A report that tries to cover everything often hides the signal you need.
One practical way to begin is to make the report small and repeatable. Run one geo-grid scan for a core service keyword, then export the matching Search Console performance view for the page that should rank for it. Build a weekly template with only the fields you will read, schedule it so it lands without someone chasing the data, and give each priority one owner. That might be a GBP edit, a review push, or a page update.
The same report should also help you understand movement, not just store it. If the grid shows stronger visibility near the business but weaker coverage farther out, that points to a local relevance gap. If a competitor keeps appearing in the Map Pack while your listing drops in the same cells, the comparison gives you a clear place to look first, whether that is the profile, the reviews, or the page tied to the keyword.
A search engine ranking report works best as a decision document. If it shows where you are visible, where you are missing, and what to improve next on Google Business Profile, it is doing the job.
If you want a cleaner way to turn ranking data into next-step actions, keep one weekly local report tied to the person who owns your Google Business Profile. Start with the geo-grid, compare it with Search Console, and make one change before the next scan so the report has a real shift to measure.
